Data Done Right: How Mozilla visualized users’ opinions of Facebook

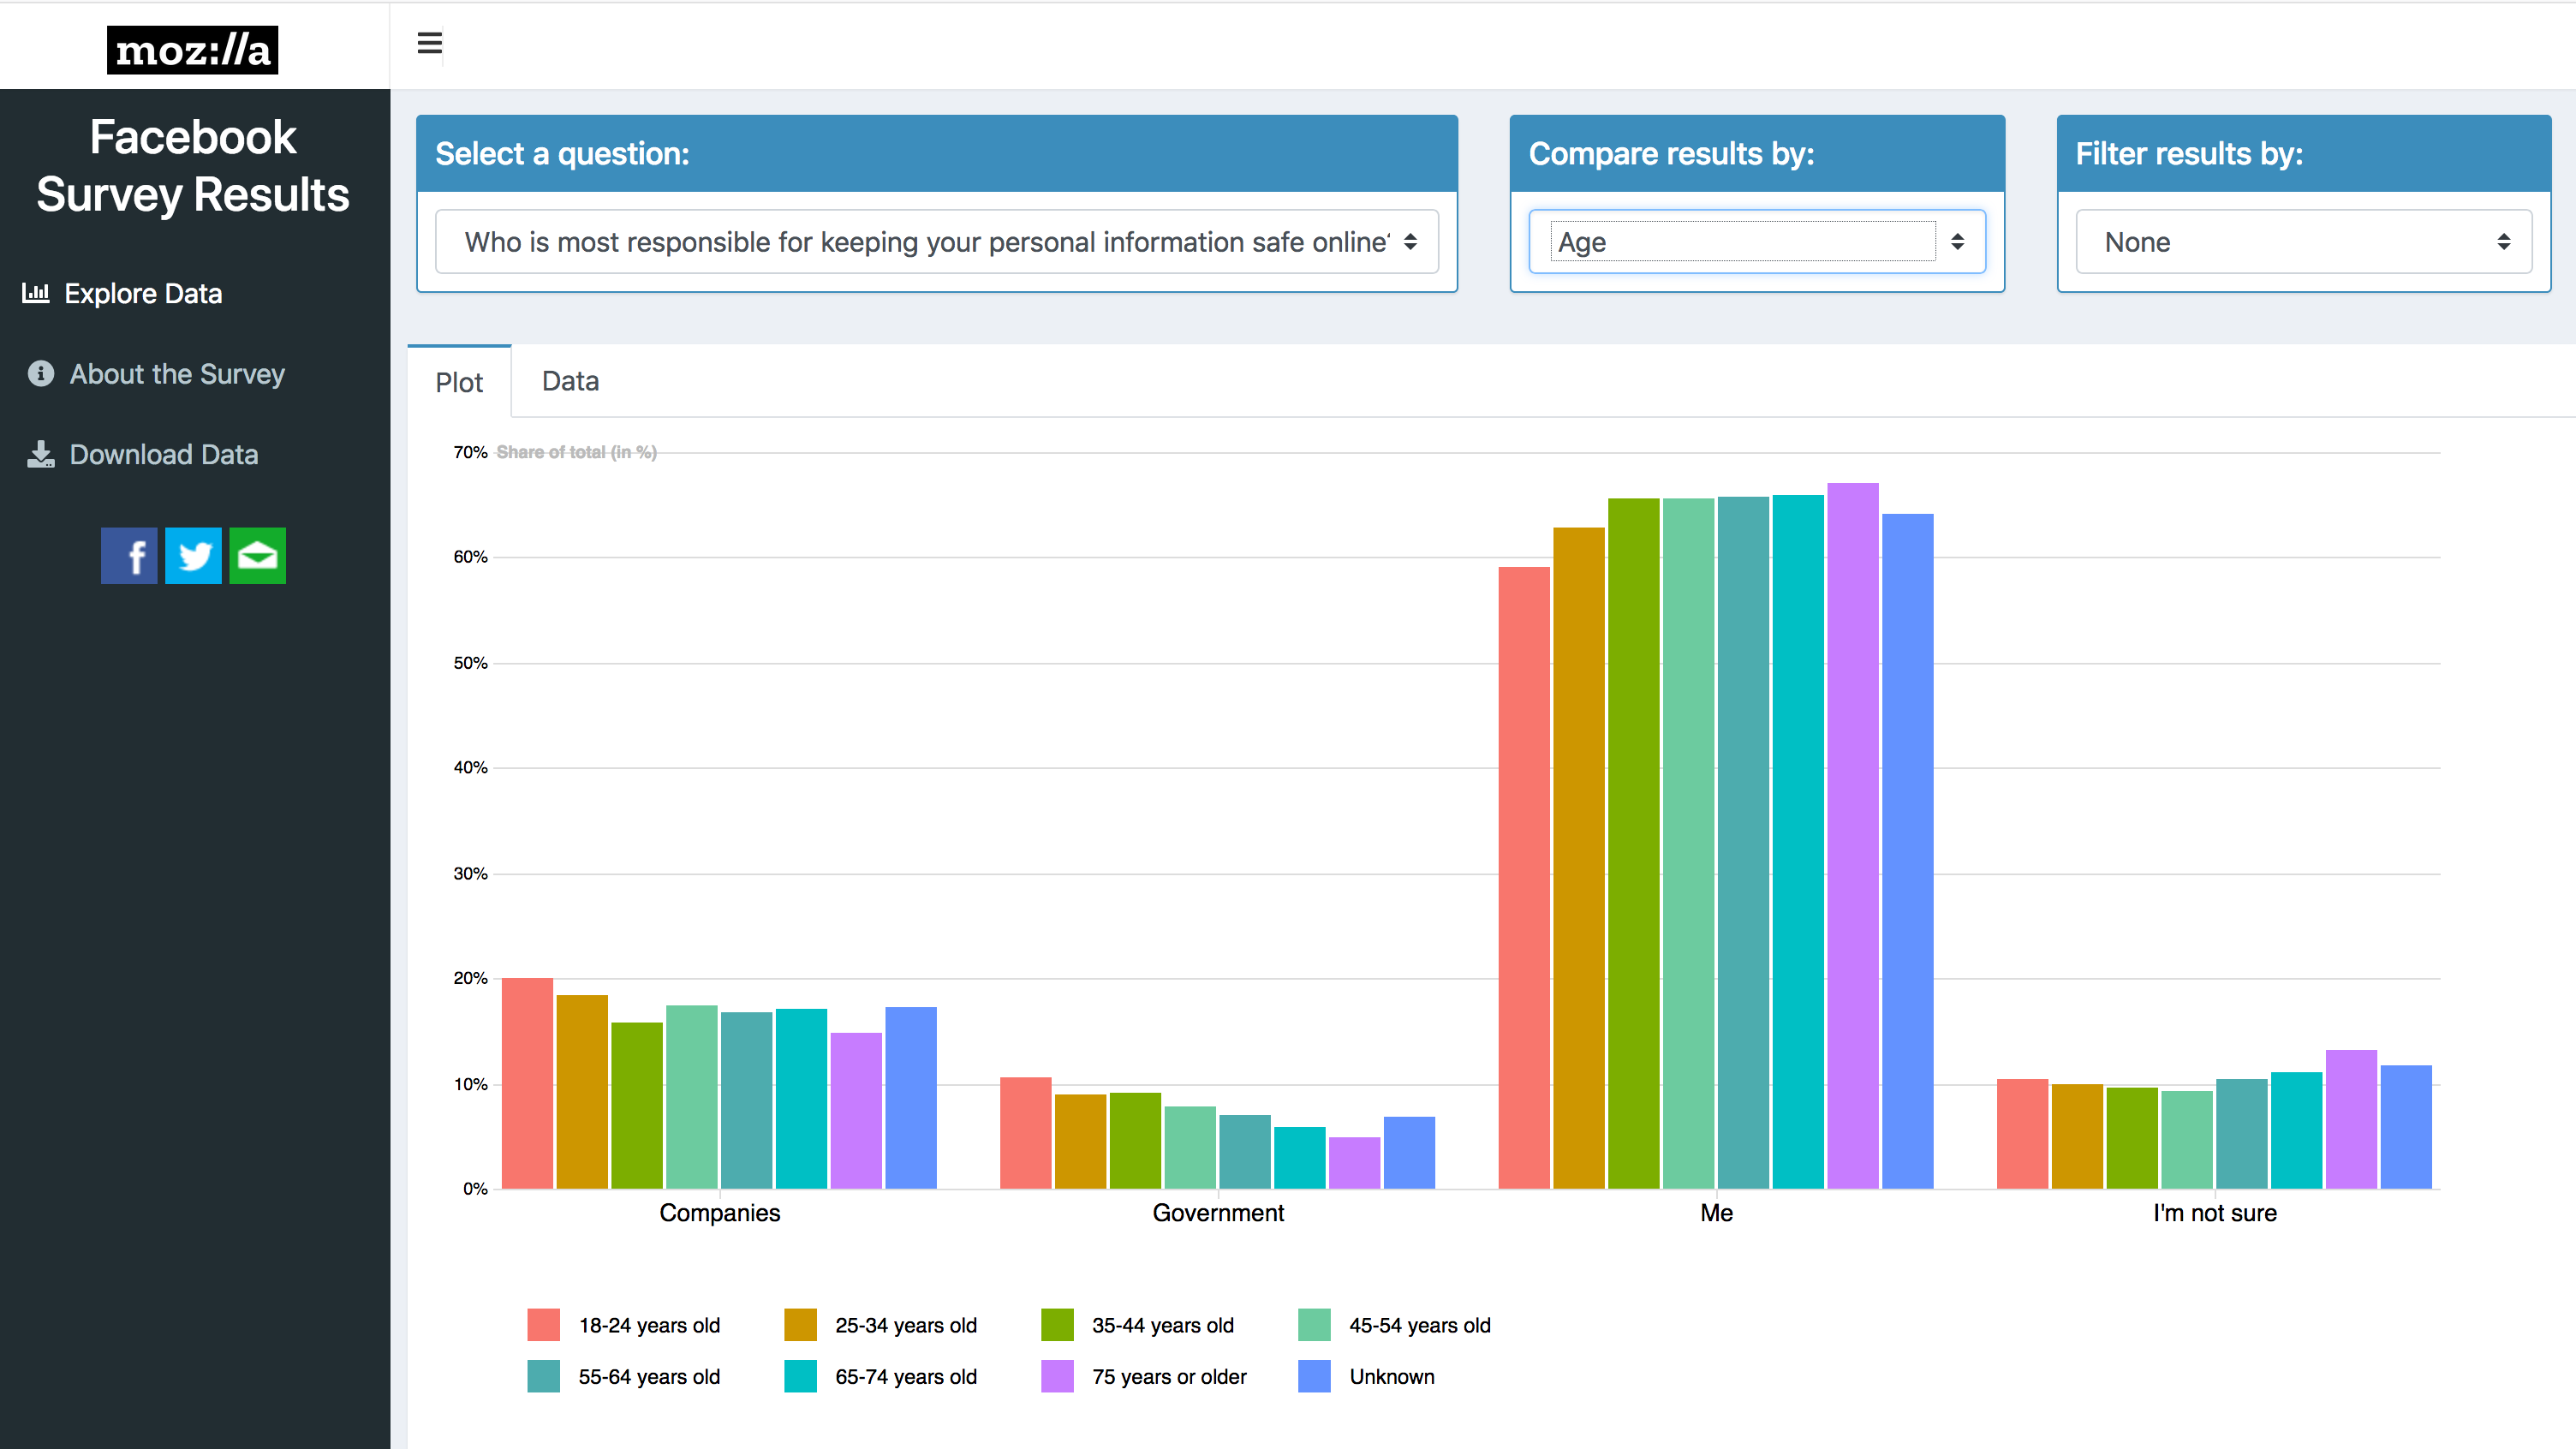
Couple of weeks ago I got to work on an interactive tool to explore data from a survey that Mozilla ran in the wake of the Cambridge Analytica revelations. I wrote a piece about my experience of building the tool, first in Shiny and later in d3js, for the Data Driven Journalism site.
You can find the full article here.