What I Learned Building a Share Progress Connector for Google Data Studio
If you are familiar with Google Data Studio, you know that it is an incredibly useful tool for building and sharing dashboards. It comes with a nifty set of built-in data connectors, from the usual suspects (GA, Adwords, Google Sheets), to more advanced data sources, such as MySQL, PostgreSQL or BigQuery. The most exciting part, however, is that, as of couple of months ago, you can also build your own connectors.
I was recently putting together a campaign dashboard that needed to include data from Share Progress, a popular sharing and A/B testing tool used by many advocacy groups. At first I was manually adding data to a Google Spreadsheet, which then fed into the dashboard, but that got tedious and tiring rather quickly, so why not automate the whole process by building a direct connector?
What I was looking for
The requirements were simple. I just wanted to circumvent manual data updates for the following metrics:
- The total number of visitors
- The total number of shares
- Breakdown of shares by channel (i.e. Facebook, Email, Twitter)
In addition, I wanted to be able to filter results for specific campaigns, to help make this a more scalable solution.
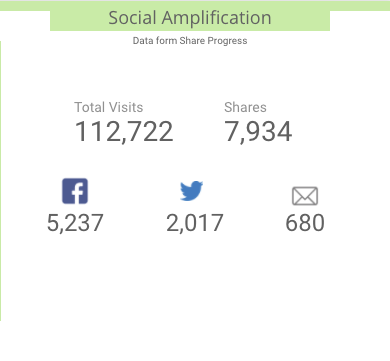
The simplest rendition of the retrieved data is something along the lines of the following.
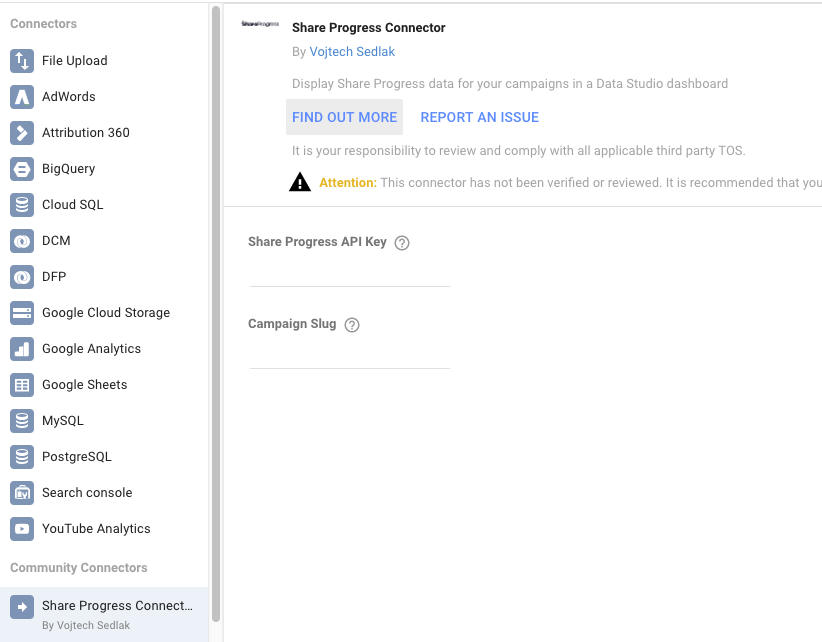
You can explore the final version of the Share Progress Connector by adding it to Data Studio. If you want to explore the connector, the full code and instructions for use are on Github
Building the connector
Google provides a pretty comprehensive documentation on how to build a connector. Essentially you create a Google Script that has a bunch of required functions and then write a manifesto that indicates the script is a connector. Deploying the script is easy and with built-in error reporting and console logging, the process isn’t that much different from any other development process.
In the simplest terms, the whole point of the connector is to put together a data table that Data Studio can parse. The main components of the community connector are outlined below, with example from the Share Progress Connector.
getConfig()
This is the function that outlines what appears on the main configuration screen of the connector. For the purposes of connecting to Share Progress, the two required fields are API key and campaign identifier.
function getConfig(request) {
  var config = {
    configParams: [
      {
        type: 'TEXTINPUT',
        name: 'SP_API_Key',
        displayName: 'Share Progress API Key',
        helpText: 'Enter the Share Progress API Key.'
      },
      {
        type: 'TEXTINPUT',
        name: 'campaign',
        displayName: 'Campaign Slug',
        helpText: 'Enter the campaign slug used to identify Share Progress buttons (using the page_url field)'
      }
    ],
    dateRangeRequired: false
  };
  return config;
}
The output of the script is above is pretty straightforward. Once you add in your API key and campaign ID, these become available through the request.configParams object. You can also specify whether date range is required, allowing you to pass start and end date to your connector code (e.g. if you’re retrieving data between two dates).
getSchema()
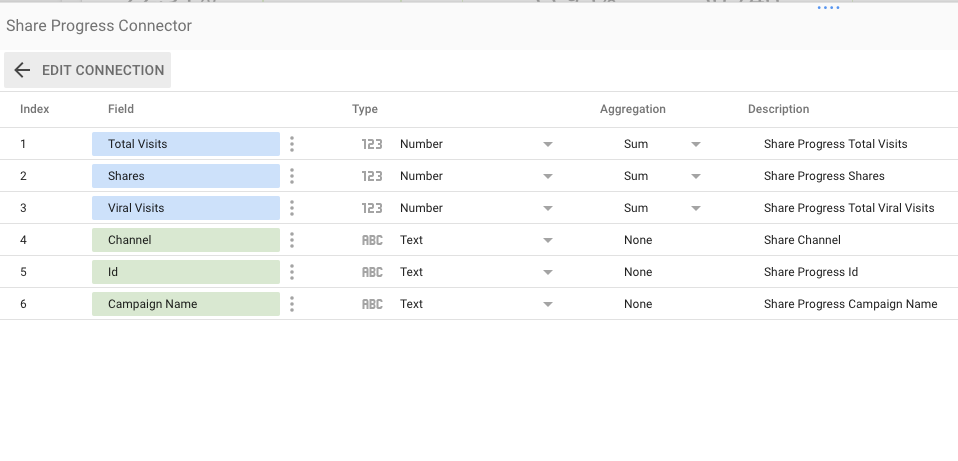
The next step is declaring the structure of the data you want to gather. Think of this as defining a table in a database. You need it think through the specific columns, what format they have in and even their semantics (e.g. are they metrics or dimensions). Below is a schema from the Share Progress connector. Note that the var fixedSchema is defined globally and then referenced in the getSchema() function. This is because the fixedSchema variable is accessed in other functions as well.
var fixedSchema = [
  {
    name: 'spId',
    label: 'Id',
    description:'Share Progress Id',
    dataType: 'STRING',
    semantics: {
      conceptType: 'DIMENSION'
    }
  },
  {
    name: 'campaignName',
    label: 'Campaign Name',
    description: 'Share Progress Campaign Name',
    dataType: 'STRING',
    semantics: {
      conceptType: 'DIMENSION'
    }
  },
  {
    name:'channel',
    label: 'Channel',
    description:'Share Channel',
    dataType: 'STRING',
    semantics: {
      conceptType: 'DIMENSION'
    }
  },
  {
    name:'totalVisits',
    label: 'Total Visits',
    description:'Share Progress Total Visits',
    dataType: 'NUMBER',
    semantics: {
      conceptType: 'METRIC'
    }
  },
  {
    name:'shares',
    label: 'Shares',
    description:'Share Progress Shares',
    dataType: 'NUMBER',
    semantics: {
      conceptType: 'METRIC'
    }
  },
  {
    name:'viralVisits',
    label: 'Viral Visits',
    description:'Share Progress Total Viral Visits',
    dataType: 'NUMBER',
    semantics: {
      conceptType: 'METRIC'
    }
  }
];


function getSchema(request) {
  console.log(fixedSchema);
  return {'schema': fixedSchema};
}
If everything is defined correctly, your schema will display as the following:
getData()
With a defined schema and all configuration parameters set, you can move on to actually handling data. This is the function that gets called every time you refresh the dashboard. There are two main components–getting data from the original source (in this case Share Progress) and formatting the data. For the purposes of keeping things easier to navigate, the data retrieval is put into its own separate function.
To get data from Share Progress the function first gets a list of all share buttons, checks which ones have a Page URL attribute that contains the campaign slug added on the config screen, and then it retrives results for the relevant buttons. You can refer to the full Share Progress API documentation here.
/*
 * Function that retrieves data from Share Progress
 * Currently limited to share buttons
 */
function getSPData(request) {
  /*
   * To help circumvent API limits, caching is employed.
   * The following checks if cached data exists and if so returns it.
   * Otherwise data is retrieved from Share Progress.
   */
  var cache = CacheService.getScriptCache();
  var cached = cache.get(request.configParams.campaign);
  if (cached != null) {
    console.log("returned cached");
    return(JSON.parse(cached));
  } else {
    console.log("returned fresh");
    var apiKey = request.configParams.SP_API_Key;
    var slug = request.configParams.campaign;
    var url = 'https://run.shareprogress.org/api/v1/buttons/';
    var finalData = [];

    // Get IDs
    try {
      var response = UrlFetchApp.fetch(url+'?key='+apiKey);
      console.log(response);
    } catch (e) {
      throwError('Unable to retrieve data. Error message: '+e.message, true);
    }
    var ids = JSON.parse(response.getContentText());


    // Get Results for each ID
    ids.response.forEach(function(d) {
      if (d.page_url.indexOf(slug) > -1) {
        try {
          var raw = UrlFetchApp.fetch(url+'analytics/'+'?key='+apiKey+'&id='+d.id);
        } catch (e) {
          throwError('Unable to retrieve data. Error message: '+e.message, true);
        }
        var results = JSON.parse(raw.getContentText());
        var row = {
          Id:'"'+d.id+'"',
          page_title:d.page_title,
          Total_visitors:results.response[0].total.total_visitors,
          viral_visitors:results.response[0].total.total_viral_visitors
        }

        if (results.response[0].share_types.facebook.shares > 0) {
          row.share_type = "Facebook";
          row.shares = results.response[0].share_types.facebook.shares;
        } else if (results.response[0].share_types.email.shares > 0) {
          row.share_type = "Email";
          row.shares = results.response[0].share_types.email.shares;
        } else if (results.response[0].share_types.twitter.shares > 0) {
          row.share_type = "Twitter"
          row.shares = results.response[0].share_types.twitter.shares
        }
        console.log(row);
        finalData.push(row);
      }
    });

    // Adding complete data to cache with an expiry of 500 seconds
    cache.put(request.configParams.campaign, JSON.stringify(finalData), 500);
    return finalData;
  }
}
The function ends up returning a simple array of objects, with each object containing key:value pairs that correspond with our schema. Note the use of CacheService, a built-in Google Script functionality, which allows you to save data between sessions. This is very useful when your target API has strict limits. For instance Share Progress limits the number of requests per minute, so adding a caching layer can help avoid errors from too many refreshes.
Here is the actual getData() function that parses the array of objects returned by the previous function and populates the virtual data table, in accordance with the schema.
/*
 * Required function that retrieves and prepares data for the Data Studio dashboard
 * See https://developers.google.com/datastudio/connector/reference#getdata for more detail
 */
function getData(request) {

  // Using an external function here for better readability and cache handling
  var content = getSPData(request);

  // Prepare data schema for population
  var dataSchema = [];
  request.fields.forEach(function(field) {
    for (var i=0; i < fixedSchema.length; i++) {
      if (fixedSchema[i].name == field.name) {
        dataSchema.push(fixedSchema[i]);
        break;
      }
    }
  });

  var data = [];

  // Provide values in the order defined by the schema.
  content.forEach(function(row) {
    var values = [];
    dataSchema.forEach(function(field) {
      switch(field.name) {
        case 'spId':
          values.push(row.Id);
          break;
        case 'campaignName':
          values.push(row.page_title);
          break;
        case 'channel':
          values.push(row.share_type);
          break;
        case 'totalVisits':
          values.push(row.Total_visitors);
          break;
        case 'shares':
          values.push(row.shares);
          break;
        case 'viralVisits':
          values.push(row.viral_visitors);
          break;
        default:
          values.push('');
      }
    });
    data.push({
      values: values
    });
  });

  return {
      schema: dataSchema,
      rows: data
    };

}
If everything goes smoothly, you should now be able to display data in your dashboard. Chances are you may run into issues, which is where it is helpful to leverage error reporting and console logging to uncover errors. The following simple function can help provide more verbose error reporting.
function throwError (message, userSafe) {
  if (userSafe) {
    message = 'DS_USER:' + message;
  }
  throw new Error(message);
}
Finally you also need to specify whether the connector uses OAuth for authentication. In this case, so I just added the following:
/*
 * Required function to indicate whether OAuth2 is used
 * See https://developers.google.com/datastudio/connector/reference#getAuthType for more detail
 */
function getAuthType() {
  var response = {
    "type": "NONE"
  };
  return response;
}
Putting it all together
You can see the full code for the Share Progress community connector on Github. If you are building your own conenctor, you also need to declare a manifesto in a separate file called appscript.json. Here is an example from the Share Progress Connector:
{
  "timeZone": "America/Los_Angeles",
  "dependencies": {
  },
  "exceptionLogging": "STACKDRIVER",
  "dataStudio": {
    "name": "Share Progress Connector",
    "company": "Vojtech Sedlak",
    "companyUrl": "https://vojtechsedlak.com",
    "description": "Connect to Share Progress",
    "logoUrl": "https://www.shareprogress.org/wp-content/themes/shpg_2015theme/dist/images/shpg_logo.png",
    "addonUrl": "https://github.com/vojtechsedlak/share-progress-connector",
    "supportUrl": "https://github.com/vojtechsedlak/share-progress-connector/issues",
    "description": "Display Share Progress data for your campaigns in a Data Studio dashboard"
  }
}
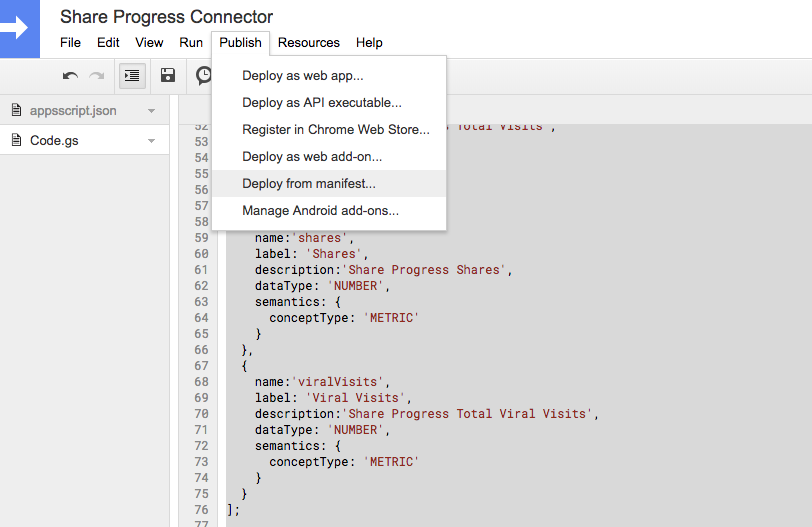
You can then deploy the connector from this manifesto using the Publish > Deploy from manifest menu item.
What I learned
Automating any manual reporting process is always a win and if Data Studio is your go-to visualization tool leveraging the community connectors is a great way to avoid unecessary copy-pasting. There is now a whole bunch of community connectors out there, though many come with a price tag attached. Google also maintains a repository of a few open source connectors, which are a great place to look, if you want to explore additional functionality.
It took a bit of time to get used to working in the Google Script editor, especially when you have to switch between different windows to find why something is not working. The biggest challenge I’ve found is with circumventing API limits. Keep in mind that when you refresh your dashboard, every element on your Data Studio dashboard triggers its own getData() function, independently of whether the elements share the same source or not. While this multiprocessing capacity is great for speed, it also means that if you have say 5 elements on your dashboard and your getData() function includes two API calls, as with the Share Progress Connector, you will actually trigger 5x2=10 API calls.
Feel free to play around with the Share Progress Connector by adding it to Data Studio. Let me know if you have any ideas or suggestsions for improvement!